Basic knowledge of surface roughness (surf test)
JIS B 0601:2013 Geometric Product Specifications (GPS)-Surface Texture: Profile Curve Method-Terminology, Definitions and Surface Texture Parameters
JIS B 0634:2017 Product Geometric Characteristics Specifications (GPS)-Filtering-Linear Profile Filter: Gaussian Filter
JIS B 0633:2001 Geometric Product Specifications (GPS) - Surface Quality: Profile Curve Method - Methods and Procedures for Evaluating Surface Quality
JIS B 0651:2022 Product Geometric Characteristics Specifications (GPS)-Surface Properties: Profile Curve Method-Characteristics of Stylus-Type Surface Roughness Measuring Instruments
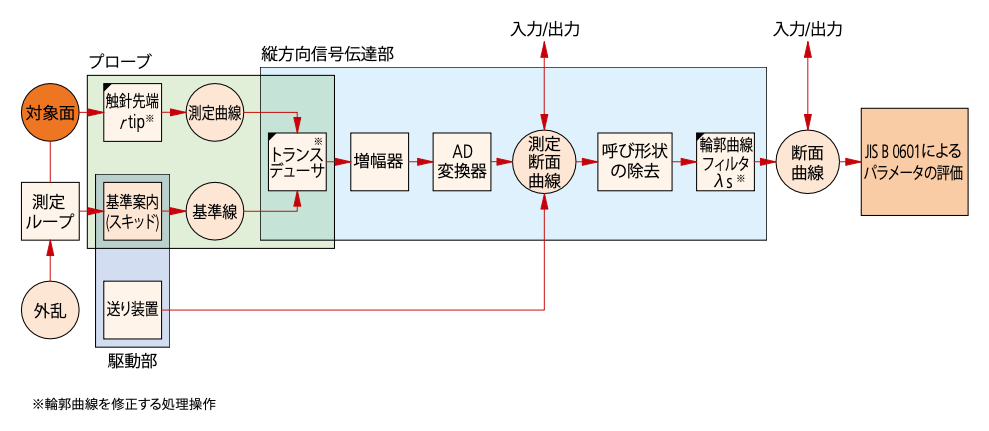
Elements of Contact Type Surface Roughness Measuring Instruments
ISO 3274: 1996 (JIS B 0651: 2001)

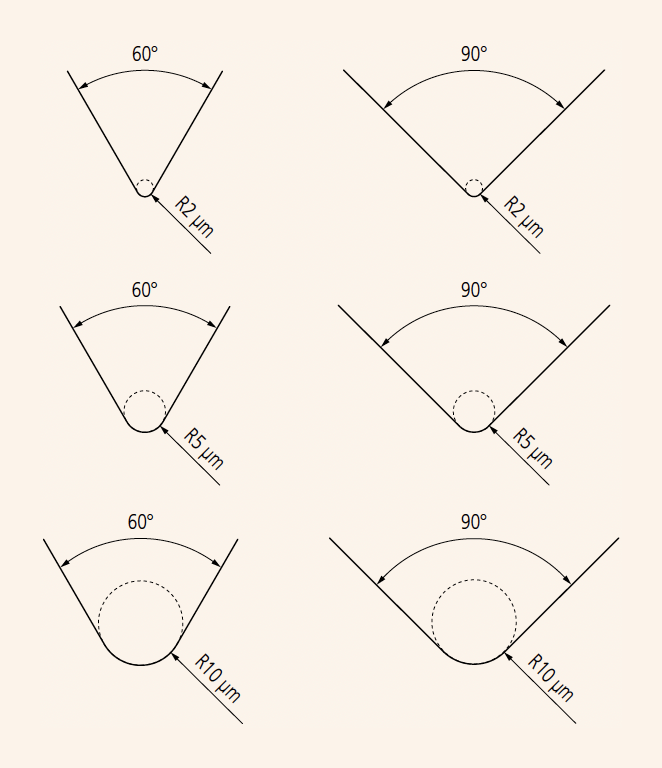
Stylus Shape
A typical shape for a stylus end is conical with a spherical tip.
Tip radius: rtip = 2 μm, 5 μm or 10 μm
Cone angle: 60°, 90°
In typical surface roughness testers, the taper angle of the stylus end is 60 ̊ unless otherwise specified.
Static Measuring Force (JISB0651)
Measuring force at the average position of the stylus: 0.75 mN
Measuring force change rate: 0 N/m
Standard characteristic value: Static measuring force at the average value of the stylus
| Nominal radius of curvature of stylus tip: μm | Static measuring force at the mean position of stylus: mN | Tolerance on static measuring force variations: mN/μm |
| 2 | 0.75 | 0.035 |
| Five | 0.75 (4.0) Note 1 | 0.2 |
| Ten |
Note 1: The maximum value of static measuring force at the average position of a stylus is to be 4.0 mN for a probe with a special structure including a replaceable stylus.
Relationship between Cutoff Value and Stylus Tip Radius
The following table lists the relationship between the roughness profile cutoff value lc, stylus tip radius r tip, and cutoff ratio lc/ls.
| λc (mm) |
λs (μm) |
λc/λs | Maximum rtip
(μm) |
Maximum sampling length (μm) |
| 0.08 | 2.5 | 30 | 2 | 0.5 |
| 0.25 | 2.5 | 100 | 2 | 0.5 |
| 0.8 | 2.5 | 300 | 2 Note 1 | 0.5 |
| 2.5 | 8 | 300 | 5 Note 2 | 1.5 |
| 8 | twenty five | 300 | 10 Note 2 | Five |
Note 1: For surfaces with Ra>0.5 μm or Rz>3 μm, using r tip=5 μm usually does not result in a significant difference in the measurement results.
Note 2: If a cutoff value ls is 2.5 μm or 8 μm, attenuation of the signal due to the mechanical filtering effect of a stylus with the recommended tip radius appears outside the roughness profile pass band. Therefore, a small error in stylus tip radius or shape does not affect parameter values calculated from measurements. If a specific cutoff ratio is required, the ratio must be defined.
Phase compensation filter characteristics
JIS B 0634:2017/ISO16610-21:2011
The filter for the contour curve is a phase compensation filter that has no phase lag (which causes the contour curve to distort depending on the wavelength).
The weighting function of the phase compensation filter is a normal (Gaussian) distribution with an amplitude transmission rate of 50% at the cutoff value.
Data Processing Flow

Surface Profiles
ISO 4287:1997 (JIS B 0601: 2013)

Primary Profile
Profile obtained from the measured profile by applying a low-pass filter with cutoff valueλs.
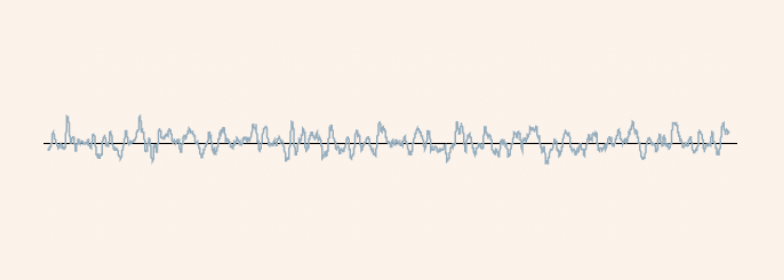
Roughness Profile
Profile obtained from the primary profile by suppressing the longer wavelength components using a high-pass filter of cutoff valueλc.
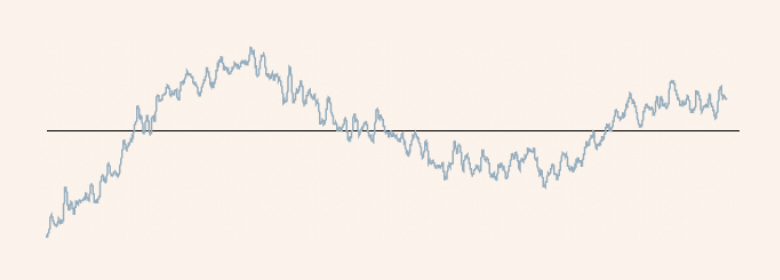
Waviness Profile
This is a profile obtained by applying profile filters with cutoff values λf and λc in sequence to the cross-sectional curve. The λf profile filter blocks long wavelength components, and the λc profile filter blocks short wavelength components.
Parameter definition
JIS B 0601:2013 (ISO 4287:1997, Amd.1:2009)
Amplitude Parameters (peak and valley)
Maximum peak height of the primary profile Pp
Maximum peak height of the roughness profile Rp
Maximum peak height of the waviness profile Wp
Largest profile peak height Zp within a sampling length

Maximum valley depth of the primary profile Pv
Maximum valley depth of the roughness profile Rv
Maximum valley depth of the waviness profile Wv
Largest profile valley depth Zv within a sampling length

Maximum height of the primary profile Pz
Maximum height of the roughness profile Rz
Maximum height of the waviness profile Wz
Sum of height of the largest profile peak height Zp and the largest pro- file valley depth Zv within a sampling length

* In the old JIS standard and ISO4287:1984, the symbol Rz is used to indicate the "ten-point average roughness." Caution is required because the difference in measurement values between the old and new standards is not necessarily so small that it can be ignored.
(It is necessary to check whether the drawing instructions are based on the old or new standard.)
Mean height of the primary profile elements Pc
Mean height of the roughness profile elements Rc
Mean height of the waviness profile elements Wc
Mean value of the profile element heights Zt within a sampling length


Total height of the primary profile Pt
Total height of the roughness profile Rt
Total height of the waviness profile Wt
Sum of the height of the largest profile peak height Zp and the largest profile valley depth Zv within the evaluation length

Amplitude Parameters (average of ordinates)
Arithmetical mean deviation of the primary profile Pa
Arithmetical mean deviation of the roughness profile Ra
Arithmetical mean deviation of the waviness profile Wa
Arithmetic mean of the absolute ordinate values Z(x) within a sampling length

Root mean square deviation of the primary profile Pq
Root mean square deviation of the roughness profile Rq
Root mean square deviation of the waviness profile Wq
Root mean square value of the ordinate values Z(x) within a sampling length

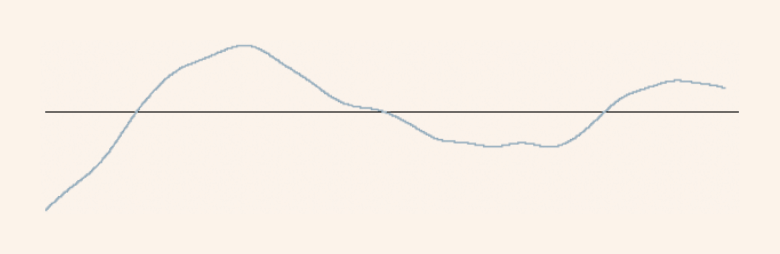
Skewness of the primary profile Psk
Skewness of the roughness profile Rsk
Skewness of the waviness profile Wsk
Quotient of the mean cube value of the ordinate values Z(x) and the cube of Pq, Rq, or Wq respectively, within a sampling length
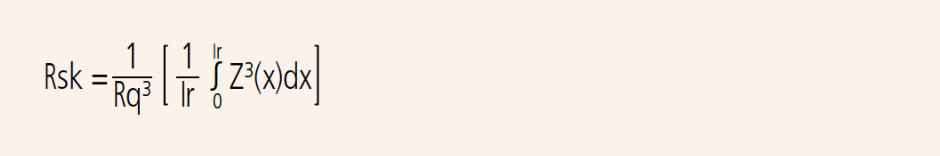
The above formula is the definition of Rsk. Psk and Wsk are similar. Psk, Rsk and Wsk are the biases (measures of asymmetry of the probability density function in the height direction).
Kurtosis of the primary profile Pku
Kurtosis of the roughness profile Rku
Kurtosis of the waviness profile Wku
Quotient of the mean quartic value of the ordinate values Z(x) and the fourth power of Pq, Rq, or Wq respectively, within a sampling length
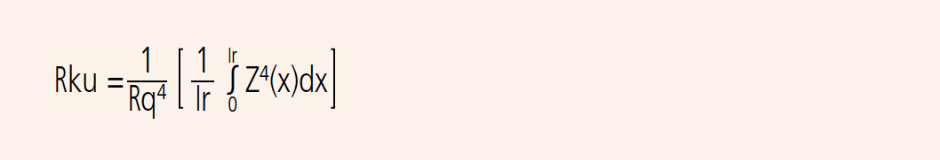
The above is the definition of Rku. Pku and Wku are similar. Pku, Rku and Wku are the quantities of sharpness of the probability density function of the ordinate values.
Hybrid Parameters
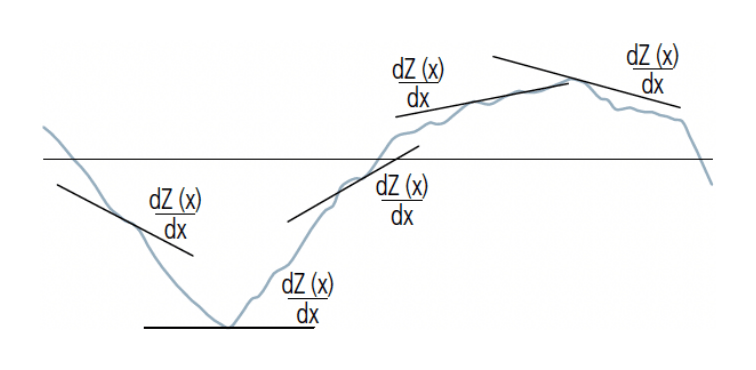
Root mean square slope of the primary profile P⊿q
Root mean square slope of the roughness profile R⊿q
Root mean square slope of the waviness profile W⊿q
Root mean square value of the ordinate slope dZ/dX within a sampling length
Spacing Parameters
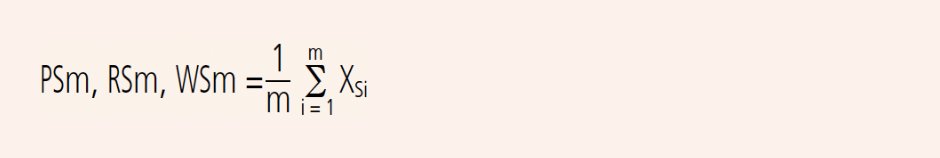
Mean width of the primary profile elements PSm
Mean width of the roughness profile elements RSm
Mean width of the waviness profile elements WSm
Mean value of the profile element widths Xs within a sampling length

JIS Specific Parameters
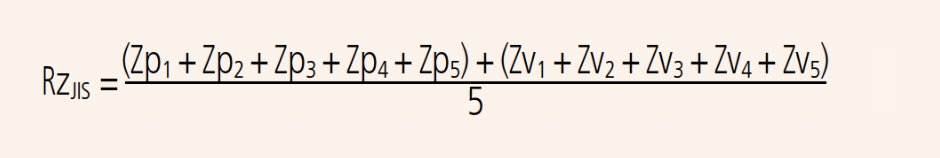
Ten-point height of irregularities, RzJIS
Sum of the absolute mean height of the five highest profile peaks and the absolute mean depth of the five deepest profile valleys, measured from the mean line within the sampling length of a roughness profile. This profile is obtained from the primary profile using a phase-correct band-pass filter with cutoff values of lc and ls.

| Symbol | Used profile |
| RzJIS82 | Surface profile as measured |
| RzJIS94 | Roughness profile derived from the primary profile using a phase-correct high-pass filter |
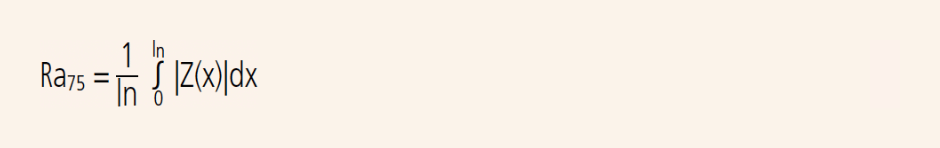
Arithmetic mean deviation of the profile Ra75
Arithmetic mean of the absolute values of the profile deviations from the mean line within the sampling length of the roughness profile (75%). This profile is obtained from a measurement profile using an analog high-pass filter with an attenuation factor of 12db/octave and a cutoff value ofλc.
Material ratio curve of the profile (Abbott-Firestone curve)
Curve representing the material ratio of the profile as a function of sec- tion level c

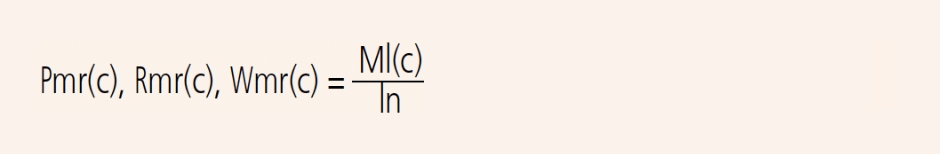
Material ratio of the primary profile Pmr (c)
Material ratio of the roughness profile Rmr(c)
Material ratio of the waviness profile Wmr (c)
Ratio of the material length of the profile elements Ml (c) at a given level c to the evaluation length
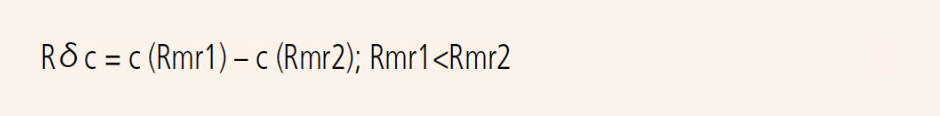
Section height difference of the primary profile Pδc
Section height difference of the roughness profile Rδc
Section height difference of the waviness profile Wδc
Vertical distance between two section levels of a given material ratio
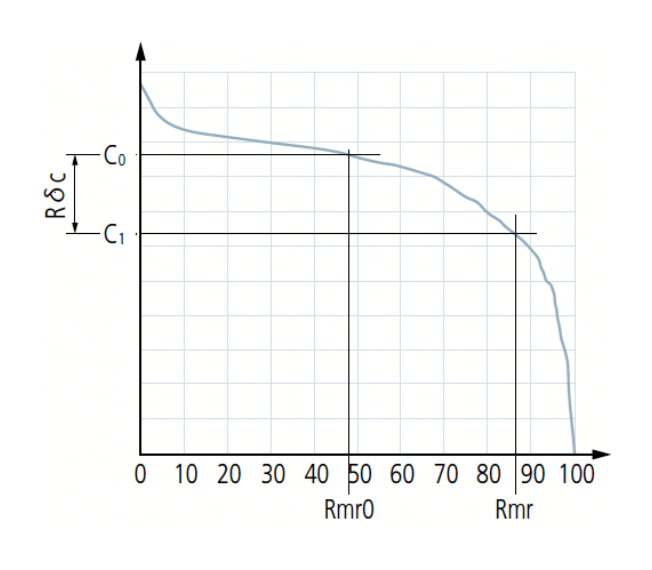
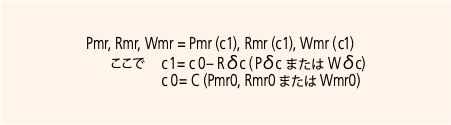
Relative material ratio of the primary profile Pmr
Relative material ratio of the roughness profile Rmr
Relative material ratio of the waviness profile Wmr
Material ratio determined at a profile section level Rδc, related to the reference section level c0
Probability density function (amplitude distribution curve)
Probability density function of height Z(x) obtained within the range of evaluation length

Roughness sampling length for non-periodic profiles
ISO 4288: 1996 (JIS B 0633: 2001)
Table 1. Sampling length of non-periodic profile roughness parameters Ra, Rq, Rsk, Rku, R⊿q and parameters related to the load curve and probability density function
| Ra (μm) | Sampling length lr (mm) | Evaluation length ln (mm) |
| (0.006)<Ra≦0.02 0.02<Ra≦0.1 0.1<Ra≦2 2<Ra≦10 10<Ra≦80 |
0.08 0.25 0.8 2.5 8 |
0.4 1.25 4 12.5 40 |
Table 2: Sampling lengths for aperiodic profile roughness parameters (Rz, Rv, Rp, Rc, Rt)
| Rz, Rz1max. (μm) | Sampling length lr (mm) | Evaluation length ln (mm) |
| (0.025)<Rz, Rz1max.≦0.1 0.1<Rz, Rz1max.≦0.5 0.5<Rz, Rz1max.≦10 10<Rz, Rz1max.≦50 50<Rz, Rz1max.≦200 |
0.08 0.25 0.8 2.5 8 |
0.4 1.25 4 12.5 40 |
1) Rz is used when measuring Rz, Rv, Rp, Rc, and Rt.
2) Rz1max is used only when measuring Rz1max, Rv1max, Rp1max, and Rc1max.
Table 3: Sampling lengths for measurement of periodic roughness profile roughness parameters and periodic or ape- riodic profile parameter Rsm
| Rsm (mm) | Sampling length lr (mm) | Evaluation length ln (mm) |
| 0.013<Rsm≦0.04 0.04<Rsm≦0.13 0.13<Rsm≦0.4 0.4<Rsm≦1.3 1.3<Rsm≦4 |
0.08 0.25 0.8 2.5 8 |
0.4 1.25 4 12.5 40 |
Procedure for determining a sampling length if it is not specified
Fig.1 Procedure for determining the sampling length if it is not specified
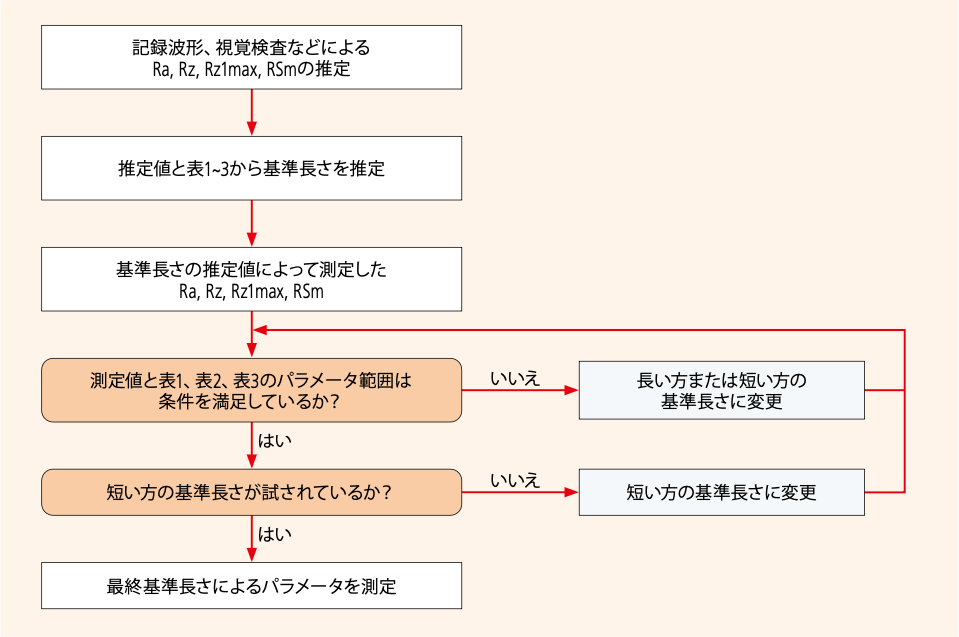
Fig.2 Procedure for determining the sampling length of a periodic profile if it is not specified.

