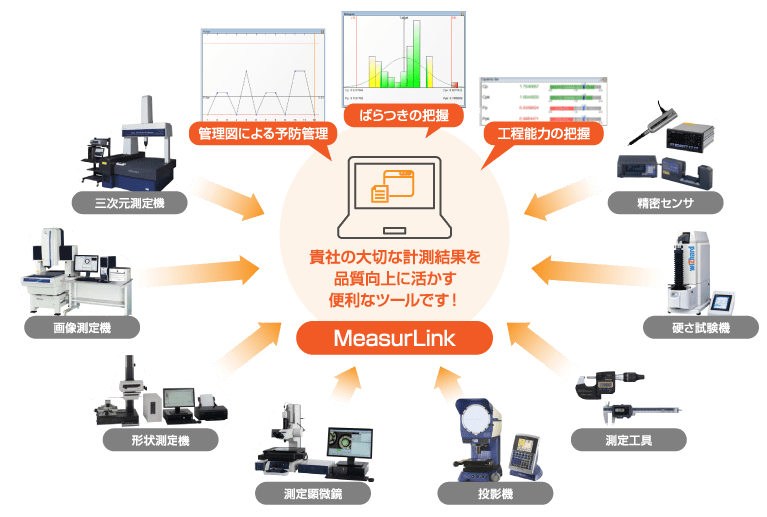
Utilizing data from the manufacturing site, we have established "SPC (Statistical Process Control)" to manufacture only quality products.
The measurement data network system "MeasurLink" collects data from various measuring devices,
Displays statistical processing results such as control charts, histograms, and process capability indices in real time.
Achieve SPC.
Data from all networked measuring devices is collected in real time, and statistical process control is performed to predict the occurrence of defects.
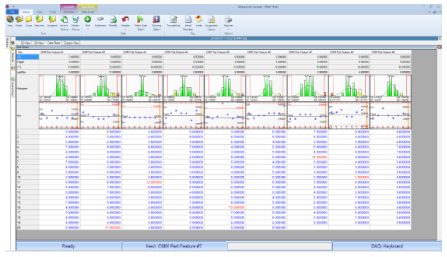
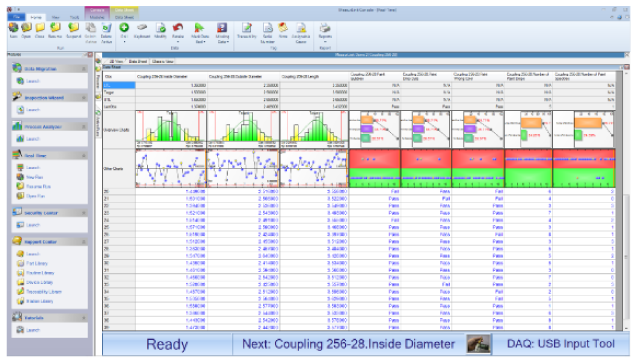
A wide variety of data collection screens are available, including statistical analysis results, data list tables, and work instruction image displays, allowing operators to easily switch between different displays depending on their purpose.
Multiple measurement items can be easily viewed and individual measurement values can be displayed in a table format.
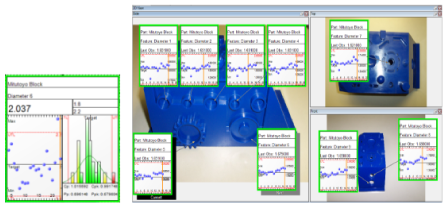
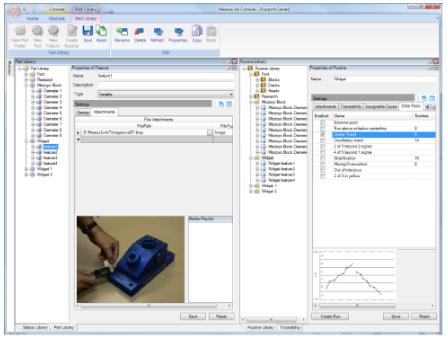
Each measurement item can be displayed with a callout line against a workpiece photo or drawing data in the background, making it usable as a work instruction sheet. The result of tolerance judgment is also indicated by the frame color.
Each measurement item can be displayed with a callout line against a workpiece photo or drawing data in the background, making it usable as a work instruction sheet. The result of tolerance judgment is also indicated by the frame color.
Dock manager control allows flexible screen layout.
* Switch tabs with one click.
A wide variety of statistical analysis and display functions allow you to obtain results suited to your characteristics and purposes.
Quantitative values: XBar-R, XBar-s, X-Rs, EWMA control chart, histogram, run chart, pre-control chart, tear chart, box and whisker chart, meter chart, indicator bar, multivariate control chart, etc. Measurement values: p, np, c, u control chart, Pareto chart, pie chart
Maximum value, minimum value, standard deviation, average ±3σ/4σ/6σ, process capability index (Cp, Cpk, Pp, Ppk), defect rate, etc.
The operator is alerted when an abnormality such as "out of tolerance" or "out of control" occurs. The alert method can be selected from pop-up window display, email notification, log file recording, etc.